Indian equities have had a difficult September. The fall has been driven mostly by events outside India: bond yields in the US and Japan have risen sharply, and global funds have moved money in response. This note explains what has happened, how far Indian indices have corrected, and why we believe the long-term case for India is intact.
1. High bond yields are moving money around the world
The US 10-year Treasury yield, the rate the US government pays to borrow for ten years, has climbed to about 5.24%, its highest level since 2007. It was just below 4.8% at the start of September. When a government bond pays over 5% with very little risk, many large investors reduce what they hold in equities, especially in emerging markets.
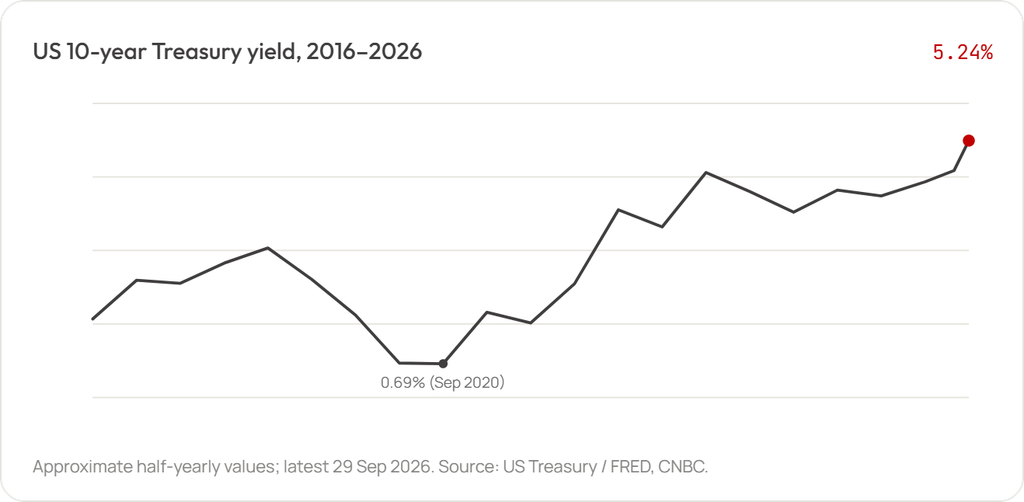
Japan has added to the pressure. Its 10-year government bond yield crossed 3% in mid-September, the highest in about three decades. For years, investors borrowed cheaply in yen and invested in higher-yielding markets, including India. As Japanese rates rise, that trade becomes less attractive and some of it is being unwound.
The result has been nervousness in the US and Japan, and hedge funds and global funds rebalancing their portfolios. India has seen selling as part of that. Foreign investors have taken out roughly ₹2.37 lakh crore from Indian equities so far in 2026. This selling is about global allocation decisions, not a change in India’s own fundamentals.
2. The rupee against the dollar
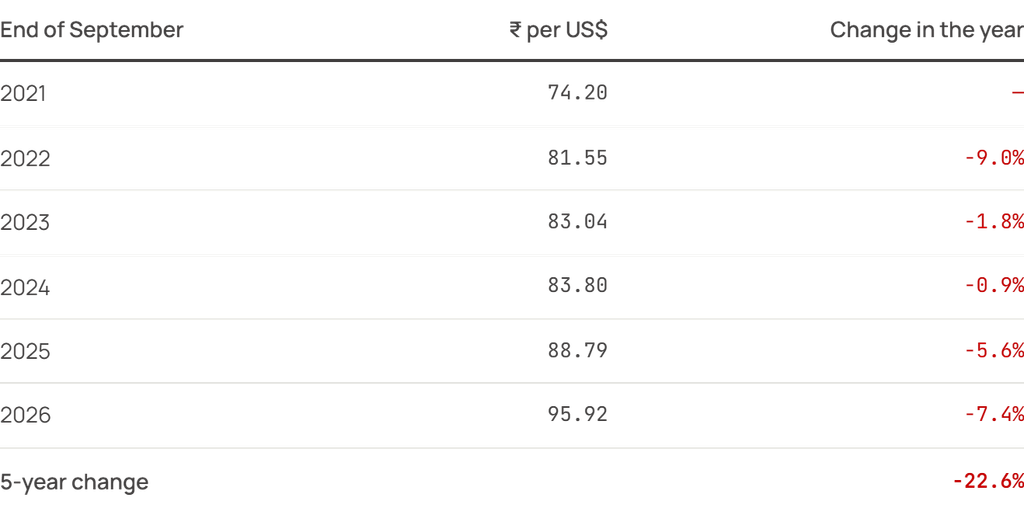
Foreign outflows, higher crude oil prices and high US yields have weakened the rupee. India’s foreign exchange reserves remain strong at about $717 billion, which gives the RBI room to manage volatility.
3. How far Indian indices are from their highs
Large caps have taken the heaviest fall. Foreign investors hold most of their Indian money in the largest companies, so when they sell, the Nifty 50 feels it first. Mid and small caps have held up better, supported by steady domestic flows including SIPs.

Fall from record high to close on 29 Sep 2026. Figures shown as record high → latest level. Midcap level is estimated from reported daily moves. Source: NSE.
4. Nifty valuations are now at a discount
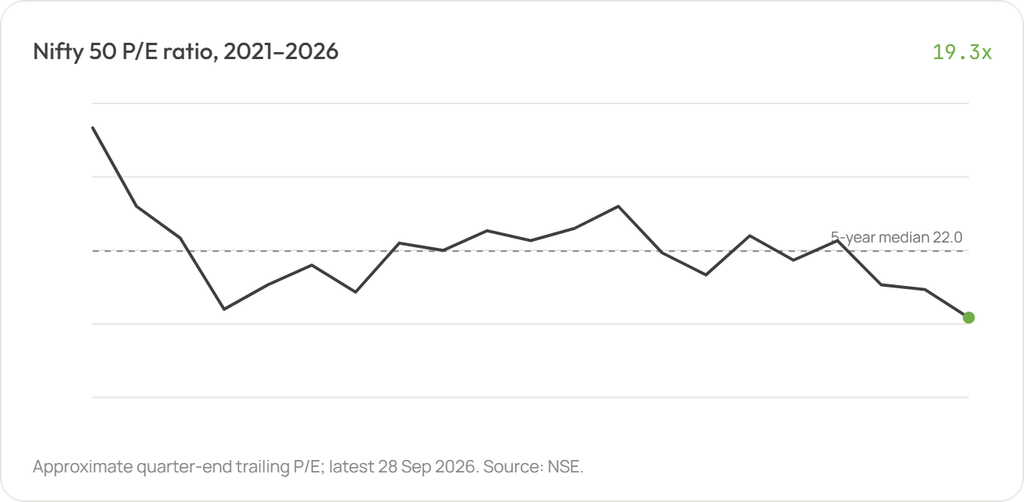
The P/E ratio tells you how much investors pay for each rupee of company earnings. Because prices have fallen while earnings have continued to grow, the Nifty 50 P/E has dropped to 19.3, its lowest level in five years and about 12% below its five-year median of 22.0.
5. India’s economy continues to grow
While global money moves around, the Indian economy has kept its pace. GDP grew 7.8% in April–June 2026, ahead of the RBI’s 7% estimate.
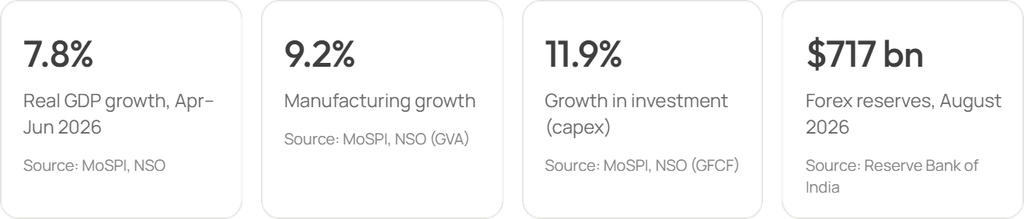
GDP, manufacturing and capex figures are year-on-year growth for Q1 FY27 (April–June 2026), MoSPI press release of 29 August 2026. Forex reserves from the RBI Weekly Statistical Supplement.
OUR VIEW
A good time for long-term investors to keep investing
The current fall is being driven by global bond markets and foreign fund flows. India’s growth story is intact: the economy is growing close to 8%, company earnings are rising, and valuations are now below their five-year average.
We suggest you continue your SIPs, avoid stopping or redeeming because of short-term moves, and consider adding to equity allocations in a staggered manner if you have surplus funds and a long investment horizon. Please speak to us before making any changes to your portfolio.
Mutual Funds are subject to market risk. Read all scheme related documents carefully.
This note is for information only and is not an offer or recommendation to buy or sell any security. Data is sourced from NSE, RBI, MoSPI, FRED and news reports, is approximate, and is as of 29–30 September 2026. Past performance may or may not be sustained in future.
Simplicity Investing · An AMFI Registered ARN-87401 Mutual Fund and SIF Distributor · 15 Years of Simplicity Investing India